Julia Sheehan
Research Analyst

Index concentration has been top of mind for investors in recent time, as fervor surrounding advances in artificial intelligence has led to outsized weights of a handful of constituents (e.g., Microsoft, NVIDIA, etc.) within domestic equity benchmarks like the S&P 500 Index. It is important to note, however, that index concentration is not simply a domestic phenomenon. For example, the Taiwanese equity market is notably exposed to technology-oriented companies, as roughly 80% of the MSCI Taiwan Index is comprised of Information Technology positions. Moreover, the index is heavily tilted toward one company in particular: Taiwan Semiconductor Manufacturing Company (TSMC). TSMC comprises just over 50% of the benchmark and has generated a year-to-date return of roughly 55% through the end of June. As it relates to these dynamics, readers may call to mind two questions: First, how did technology (and semiconductor manufacturing, in particular) come to play such an integral role within the Taiwanese economy? And second, to what extent are global semiconductor supply chains reliant on Taiwan?
TSMC was founded in 1987, with capital provided by the Taiwanese government in hopes of starting a new national industry. At that time, the company decided to focus solely on semiconductor production, which meant creating fabrication plants to manufacture chips for other businesses. This innovative model, commonly known as the foundry model, allowed TSMC to work with semiconductor companies that designed their own chips as opposed to competing against them. It is evident now that this model was hugely successful, as the current revenue share of TSMC accounts for more than 60% of the global semiconductor foundry market. The total market share of Taiwan reaches 70% when one includes other Taiwanese foundry companies (e.g., UMC, PSCM, and VIS). Factors that have led to the country’s strong success in this market include the aforementioned creation of the foundry model, as well as the highly efficient nature of Taiwanese semiconductor companies and the fact that employees in Taiwan’s semiconductor workforce are compensated well relative to those employed in other industries.
Taiwan is clearly the dominant participant in the foundry market, but it is important to note that the production of semiconductors depends on multiple players, including “fabless” chip designers (e.g., NVIDIA), companies that test and package chips, and end manufacturers. This means that the semiconductor supply chain extends well beyond Taiwan, although the country’s role within that chain is clearly crucial, as evidenced by the global chip shortage during the COVID-19 pandemic. In the wake of that shortage, and with continued geopolitical concerns surrounding China and Taiwan, countries around the world have aimed to de-risk supply chains and, therefore, have made significant investments in their domestic semiconductor industries. To that point, many European countries, as well as China, Japan, and the United States, have all committed significant resources to this endeavor. With increasingly complex artificial intelligence requiring more sophisticated chips, the semiconductor space still appears to present compelling investment opportunities, both within Taiwan and throughout the rest of the world.
Print PDF
The opinions expressed herein are those of Marquette Associates, Inc. (“Marquette”), and are subject to change without notice. This material is not financial advice or an offer to purchase or sell any product. Marquette reserves the right to modify its current investment strategies and techniques based on changing market dynamics or client needs.
03.30.2026
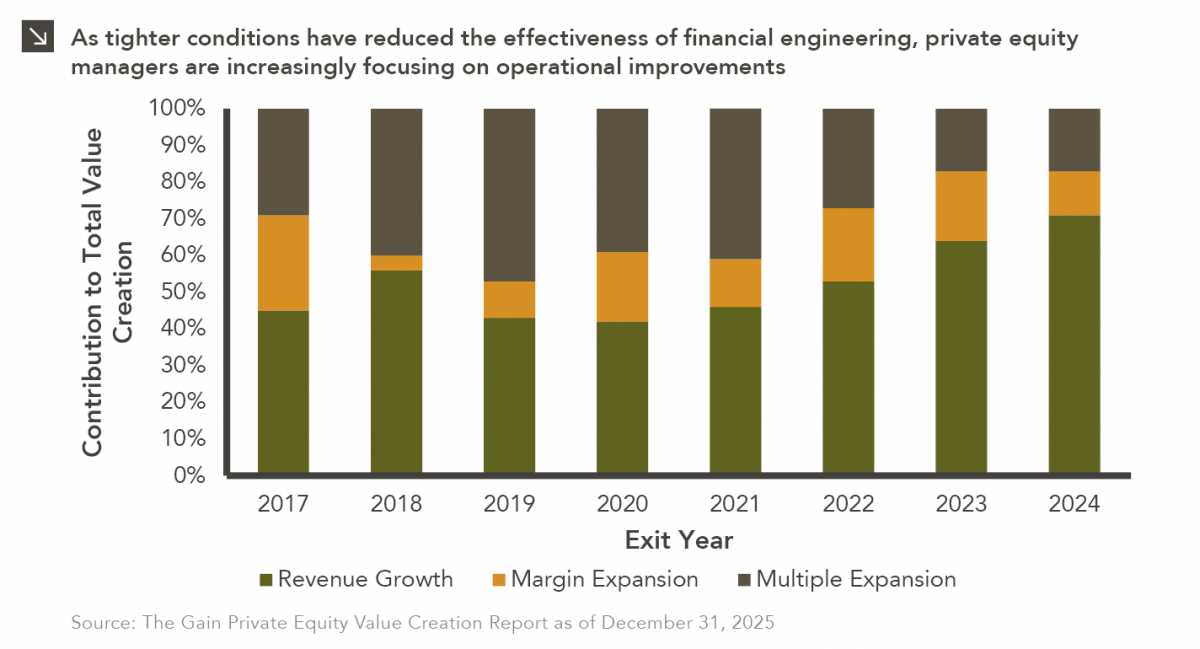
In the period between 2009 and 2022, private equity managers thrived amid an environment of low interest rates and rising…

03.23.2026
Global energy costs have risen sharply this month due to a convergence of geopolitical shocks, as critical infrastructure and transport…

03.16.2026
This week’s chart illustrates a clear structural shift in the fundraising dynamics of North American closed-end real estate funds over…

03.09.2026
Warren Buffett once implored investors to “be greedy when others are fearful,” and this sage advice is certainly applicable to…

03.02.2026
Recent market dynamics in the software sector reflect a sharp shift in investor sentiment driven primarily by concerns that advances…

02.23.2026
Most have traditionally viewed a successful exit for a venture-backed start-up as either an IPO or an acquisition by a…
Research alerts keep you updated on our latest research publications. Simply enter your contact information, choose the research alerts you would like to receive and click Subscribe. Alerts will be sent as research is published.
We respect your privacy. We will never share or sell your information.
If you have questions or need further information, please contact us directly and we will respond to your inquiry within 24 hours.
Contact Us >